 MultiScan SDR
MultiScan SDR – User guide
Wideband scanner with pseudo-spectrum for RTL-SDR, HackRF and Airspy
Contents
1Introduction
MultiScan SDR turns an inexpensive SDR receiver into a fast wideband scanner. It sweeps whole frequency bands in seconds, recognises real transmissions and automatically opens up to ten receive channels (VFOs) at the same time – with audio, recording and, if you like, a written transcript.
At its heart is the pseudo-spectrum: instead of raw power it shows, for every channel, how far a signal rises above the local noise. Unmodulated carriers, wideband noise (QRM), impulses and the receiver's own spurs are filtered out. One threshold therefore works for all bands, and the scanner only stops on real radio traffic.
Features
- Receivers: RTL-SDR (v3/v4), HackRF One, Airspy R2/Mini, SDRplay RSP (RSP1, RSP1A, RSP1B, RSP2, RSPduo, RSPdx) and Fobos SDR – plus a simulator to try it without hardware
- Web control (full version): operate and listen in a browser – on a phone, tablet or another computer in the home network
- Pseudo-spectrum with carrier, QRM, impulse and spur filters, one threshold for all bands
- Several bands side by side, with waterfall, time markers and zoom
- Up to 10 VFOs at once: AM, NFM, WFM, with audio waterfall, stereo placement by frequency, CTCSS display
- Band plan database for Germany (up to 5 GHz), the Netherlands, Austria, Switzerland, France, Spain, the United Kingdom and Poland – plus your own band plans
- Frequency database with import/export (SDR# frequencies.xml, CSV); known frequencies are labelled in the spectrum
- Lockouts: permanent (red), temporary (orange) and automatically detected own interference (blue), multi-select with Shift + drag
- Own interference scan: antenna off, check the whole receiver range, lock out local interferers automatically
- WAV recording, CSV log, activity log (Logs) with search, filters and playback
- Speech to text per VFO (Whisper, runs locally on your computer), live while the transmission runs, with search words: matches appear red, bold and blinking and are logged at once
- Decoders (full version): ADS-B with callsign, type and photo, AIS, 433 MHz sensors with temperature curve, ACARS, packet radio (APRS), DTMF, DCS and CTCSS
- Profiles, backup with automatic daily copy, light/dark mode, text size, English/German/French
- For Mac (Apple silicon) and Windows 10/11 (64-bit) – free to use, the full version with all features with a support payment
2Installation
Mac
Drag “MultiScan SDR” into the Applications folder and start it. On the first start macOS reports that the app could not be checked: System Settings ▸ Privacy & Security ▸ “Open Anyway”. The drivers for RTL-SDR, HackRF and Airspy and the speech recognition are included; nothing else needs to be installed. Exception: for SDRplay receivers install the free “SDRplay API 3.x” from sdrplay.com. Requires macOS 11 or later on a Mac with Apple silicon.
Windows
Unzip the archive and start MultiScan.exe. For RTL-SDR, HackRF and Airspy switch the USB driver once to WinUSB with Zadig (zadig.akeo.ie). Speech to text needs the “Microsoft Visual C++ Redistributable (x64)”, which most PCs already have. SDRplay: instead of Zadig install the “SDRplay API 3.x” from sdrplay.com. Fobos SDR: Zadig to WinUSB and put fobos.dll from the RigExpert software package into the program folder.
3Free version and full version
MultiScan SDR is free to use without a time limit. The free version includes the scanner, pseudo-spectrum, band plans, lockouts, own interference scan, logs and up to 2 VFOs. For a support payment you receive an unlock code for the full version. It additionally unlocks:
- up to 10 VFOs at the same time
- frequency database: tab, editing window, “Save as channel” (💾), import/export, scan by tags
- recording as WAV and CSV log
- decoders: ADS-B (aircraft), AIS (ships), 433 MHz sensors, ACARS, packet radio (AX.25/APRS), DTMF, DCS and CTCSS
- speech to text with live transcription and search words
In the free version these features stay visible but are greyed out and marked with 🔒. Clicking a 🔒, “🔑 Register …” or “♥ Support” opens the unlock window:
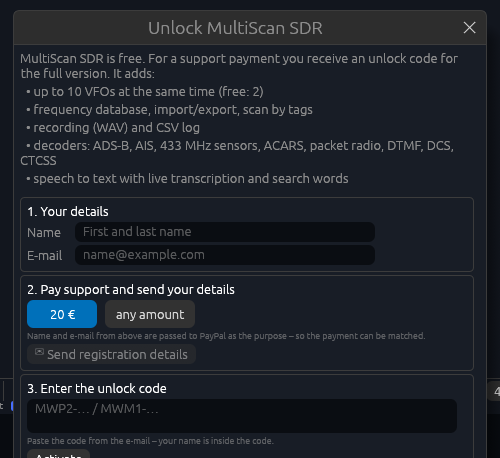
- Enter your name and e-mail address.
- Pay support via PayPal (€20 or any amount; name and e-mail from step 1 are passed to PayPal as the purpose) and click ✉ Send registration details – this prepares an e-mail with your details.
- Paste the unlock code from the reply e-mail and click Activate. Your name is encrypted inside the code and then appears at the top next to “✓ Full version”.
The code works on all your computers, Mac and Windows, and for all profiles. Clubs, companies and authorities can get a master license for any number of computers on request. Single codes can be blocked if misused; for this the program loads a block list from the internet once at start (no data is sent).
4Quick start
- Plug in the receiver and select it on the left under Receiver (without hardware: Simulator).
- Under Scan ranges click Choose frequency bands… and tick the bands you want – for example 2 m, airband and 70 cm.
- Click Start scan at the top left. The pseudo-spectrum fills up, active frequencies open VFOs with audio automatically.
- Lock out unwanted frequencies with LO (permanent) or TMP LO (until the next start) in the VFO – or in the spectrum with a right click (menu) or by dragging over a range.
- For receivers with many internal spurs, run the own interference scan under Setup once (see below).
5The main window
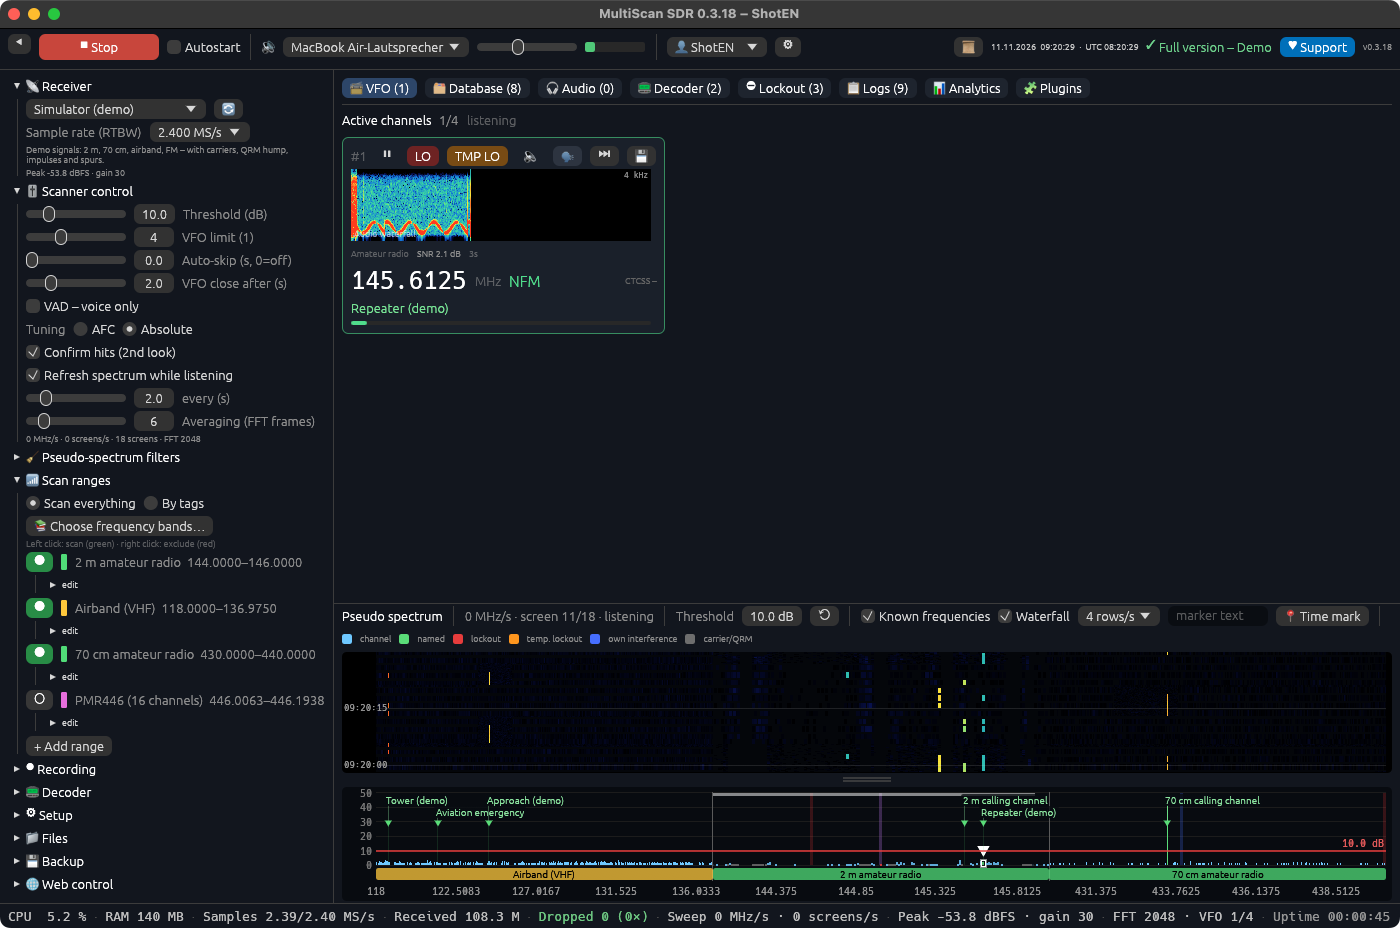 123456
- Top bar: start/stop scan, autostart, audio output, volume and level, profile, history, date and time, license, support, version.
- Left menu: all settings in collapsible sections. ◀ hides it.
- Tabs: VFO, Database, Audio, Lockout, Logs, Analytics and Plugins.
- Active channels: one card per VFO with audio waterfall, frequency, name and buttons.
- Pseudo-spectrum with waterfall: all scanned channels, threshold, lockouts and known frequencies.
- Status line: CPU, memory, sample rate, received and dropped samples, sweep speed, level.
Top bar
| Setting | Values | Meaning |
|---|---|---|
| Start scan / Stop | Starts and stops the scanner. While scanning, the receiver is in use. | |
| Autostart | on/off | Starts scanning automatically when the program starts. |
| Audio output | list | Speakers or headphones for all VFOs. |
| Volume | 0–200 % | Master volume; next to it the level meter (red = clipping). |
| Profile 👤 | Switches the profile. Each profile has its own settings, bands, database and lockouts and opens in its own window. ⚙ manages profiles (new, rename, open at start). | |
| 📜 History | List of the latest activations with time, duration, frequency and name. | |
| Date · time · UTC | Date, local time and coordinated universal time (UTC), to the second. In a narrow window the display gets shorter step by step – first without the date, then without UTC, finally just the time; the full information is in the tooltip. | |
| ✓ Full version – name | Unlocked full version with the name from the unlock code (for a master license its label); a click shows the license. In the free version this place shows “🔑 Register …” and the note “Unlock the full version with a support payment!”. | |
| ♥ Support | Support the project via PayPal. In the free version the button opens the unlock window. |
6Left menu
Receiver
| Setting | Values | Meaning |
|---|---|---|
| Receiver | RTL-SDR, HackRF, Airspy, SDRplay, Fobos, Simulator | Choose the device; 🔄 searches for connected devices again. Devices not found are marked. |
| Stick | Automatic / device | With several receivers of the same type connected: which one is used (number and serial number). Automatic takes the first one that is not busy in another program. |
| Sample rate (RTBW) | per device | Bandwidth captured in one step. Higher = faster sweep, but more CPU and USB load. Airspy Mini: 3/6 MS/s native, 10 MS/s possible; Airspy R2: 2.5/10 MS/s; HackRF 2–20 MS/s; RTL-SDR 1–3.2 MS/s (2.4 MS/s is stable on every stick). |
| RTL-SDR: AGC, gain, PPM | steps, PPM −100…100 | Automatic gain or a fixed step; PPM corrects the crystal's frequency offset. |
| HackRF: amp, LNA, VGA | LNA 0–40 dB (steps of 8), VGA 0–62 dB (steps of 2) | Additional preamp and the two gain stages. |
| Airspy: linearity gain | 0–21 | Gain in linearity mode; bit packing reduces the USB load. |
| SDRplay: LNA state, IF gain reduction, AGC | LNA 0–9 (RSPdx up to 27), IF 20–59 dB | LNA state 0 = most gain, higher states attenuate against strong stations. IF gain reduction fixed or automatic (AGC). Sample rate 2–10 MS/s; the RSPduo uses tuner 1. |
| Fobos SDR: LNA, VGA | LNA 0–3, VGA 0–31 | The two gain stages. Frequency range 50 MHz – 6 GHz, sample rate 8–20 MS/s. |
| Bias tee | on/off | Powers an active preamp at the antenna through the coax. |
| Overload protection | −30…−1 dBFS | Lowers the gain automatically when peaks exceed this value. Below: current peak and gain. |
Scanner control
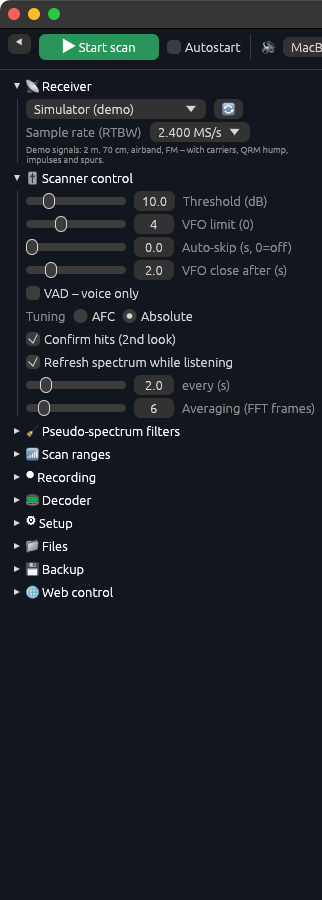
| Setting | Values | Meaning |
|---|---|---|
| Threshold (dB) | 3–40 dB, default 10 | How far a signal must rise above the noise in the pseudo-spectrum to open a VFO. You can also drag the red line in the spectrum. |
| VFO limit | 1–10 (free: 1–2) | Maximum number of VFOs open at the same time. In brackets: currently open. |
| Auto-skip (s) | 0–120 s, 0 = off | Closes a VFO after this time even if the transmission continues. |
| VFO close after (s) | 0.5–300 s, default 2 | When the signal is gone the audio is muted at once, but the VFO stays open this long and waits for the reply – the card counts down with ⏳. If the signal returns it continues on the same VFO. When all VFOs are taken and a new signal appears, the VFO that has been quiet longest makes room. Paused VFOs never close. With NFM and AM every VFO checks by itself whether a carrier is still there (power inside the channel): once the carrier is gone, the VFO closes exactly after this time – even if the spectrum, which is refreshed only every few seconds while listening, still shows something. |
| VAD – voice only | on/off | Plays audio only when speech is detected; VFOs without speech (noise, data bursts) are closed again. With “Lock VAD state” such VFOs stay open and are just muted. |
| Tuning | AFC / Absolute | AFC tunes to the measured signal centre and follows drift; Absolute stays on the channel frequency of the raster. |
| Confirm hits (2nd look) | on/off | A channel only opens if it is still active on a second measurement – fewer false alarms from short spikes. |
| Refresh spectrum while listening | on/off, every 0.5–10 s | Briefly visits the other band sections while VFOs are open so spectrum and waterfall stay current (short audio gap). |
| Averaging (FFT frames) | 2–32 | How many FFT frames are averaged per measurement. More = calmer spectrum, but slower sweep. |
Pseudo-spectrum filters
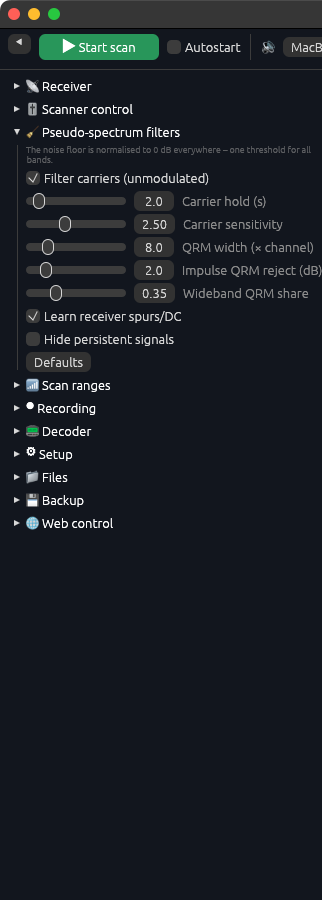
The noise floor is normalised to 0 dB for every frequency. The filters work on top of that; their defaults suit most cases, Defaults restores them.
| Setting | Values | Meaning |
|---|---|---|
| Filter carriers | on/off | Unmodulated steady carriers (oscillators, beacons, power supplies) do not open a VFO. A transmission opens as soon as modulation shows up. |
| Carrier hold (s) | 0.5–20 s | How long a signal has to be steady to count as a carrier. |
| Carrier sensitivity | 1–5 | Higher = carriers are recognised earlier. |
| QRM width (× channel) | 3–30 | Anything wider than this factor times the channel width (noise humps, PSU QRM) becomes part of the noise floor. |
| Impulse QRM reject (dB) | 0.5–10 dB | Suppresses short wideband impulses that raise many channels at once. |
| Wideband QRM share | 0.1–1.0 | Share of channels from which a simultaneous rise counts as wideband interference. |
| Learn receiver spurs/DC | on/off | Learns spurs that move with the device's tuning (DC spike, images) and hides them. |
| Hide persistent signals | on/off, after 5–600 s | Signals that never stop are ignored after this time. |
Scan ranges
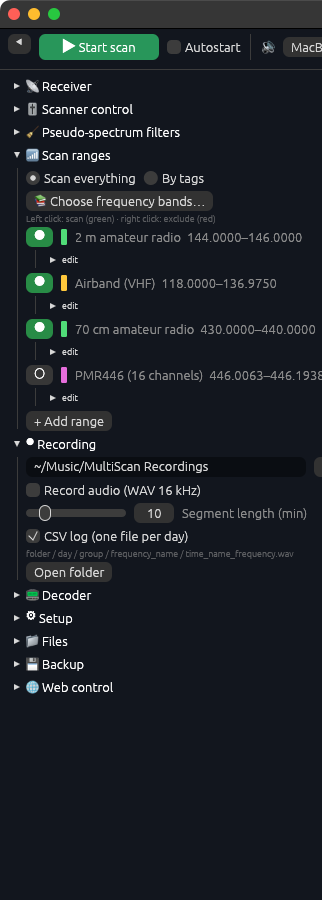
Scan everything sweeps all active ranges. By tags scans only the frequency-database channels of the selected groups instead. Choose frequency bands… opens the band plan database: left click adds a band to the scan (green), right click excludes it (red). Every range has a switch and can be adjusted under edit: name, from/to, step (channel spacing), width and modulation. + Add range creates your own range. Several ranges appear side by side in the spectrum, every band equally wide.
Recording (full version)
| Setting | Values | Meaning |
|---|---|---|
| Record audio | WAV 16 kHz | Every activation is saved as a file: folder / day / group / frequency_name / time_name_frequency.wav. |
| Segment length (min) | 1–60 min | Long transmissions are split into files of this length. |
| CSV log | on/off | One table per day with all activations. |
Speech to text (full version)
A section of its own in the left menu. 🗣 in a VFO card transcribes that channel; recognition (Whisper) runs locally on your computer.
| Setting | Values | Meaning |
|---|---|---|
| Enable speech to text | on/off, default off | Main switch. On: every VFO is transcribed automatically without holding it – the scanner goes on, the text appears in the card’s text window (🗣 green). Clicking 🗣 additionally holds a channel (VFO paused, 🗣 blue), a second click releases it. Off: no speech to text. The text windows reach down to the spectrum by themselves. |
| Live transcription | on/off, default on | Text while the transmission runs: every 2.5 s the part received so far is recognised and shown as a “● LIVE” line (first words after about 3–4 s); at the end the complete text replaces this line. Search words already trigger on the live text but are logged only once per transmission. Needs more CPU. |
| Detect the language | on/off, default off | The recogniser determines the language of every transmission itself. Off: set the language of the radio traffic – often more accurate for short radio calls. |
| Language of the radio traffic | By band, German, English, French | Used when “Detect the language” is off. By band: aviation and military English, everything else German. |
| Translate | on/off, default off | The transcript appears translated instead of the original. Target: English – the local recogniser can only translate into English; German and French as targets are coming. |
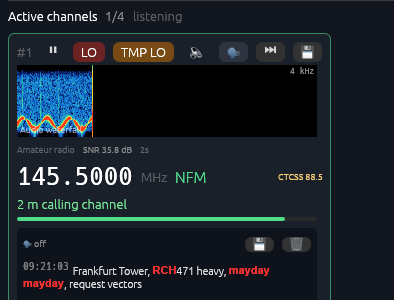
| Search words | list, separated by commas | For example “RCH, reach, mayday”. When speech recognition hears one of these words, it appears in the transcript red, bold and blinking (for a minute, then steady red), and a Logs entry with frequency, name, band and text is written at once. Case does not matter; only whole words count – so “RCH” finds “RCH 471” and “RCH471”, but not “search”. |
| Transcript text size | 8–24 pt | Text size in the transcription window below the VFOs. |
Decoder (full version)
| Setting | Values | Meaning |
|---|---|---|
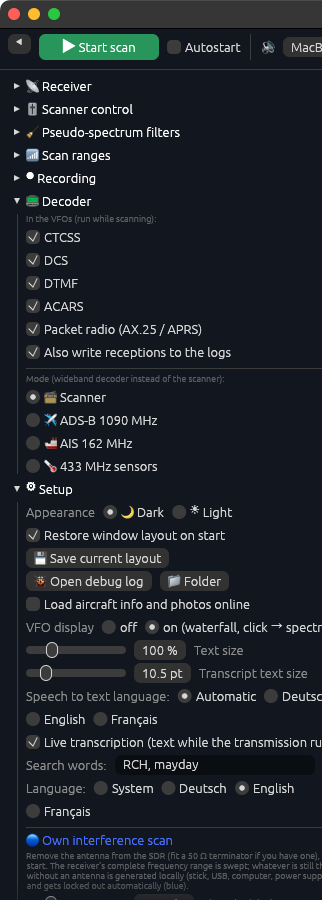
| CTCSS, DCS, DTMF | on/off | Run in every NFM VFO: CTCSS sub-tone, DCS code (e.g. “023N”) and DTMF digits are shown in the VFO card and kept in the log with the frequency (columns CTCSS, DCS, DTMF). |
| ACARS | on/off | Aircraft data link in AM VFOs in the airband (e.g. 131.525 / 131.725 / 131.825 MHz). Messages in the Decoder tab ▸ Messages. |
| Packet radio (AX.25 / APRS) | on/off | 1200 Bd AFSK in NFM VFOs, e.g. APRS on 144.800 MHz. Every frame as “callsign>destination,path: text” in the Decoder tab. |
| Mode | Scanner / ADS-B / AIS / 433 MHz | Wideband decoder instead of the scanner: the receiver stays on 1090 MHz, 162.000 MHz or 433.92 MHz. ▶ then reads “Start decoder”. For both at the same time use a second SDR stick in a profile of its own (own window). |
Setup
| Setting | Values | Meaning |
|---|---|---|
| Restore window layout on start | on/off, default on | On exit, window size and position, the width of the left menu, the height of the spectrum, the open tab and the size of the text fields are saved and restored on the next start. When off, the program starts with the default layout. All other settings (bands, VFO limit, threshold, lockouts, search words …) are always saved. |
| 💾 Save current layout | button | Saves window size and position, width of the left menu, height of the spectrum, open tab, size of the text fields and all settings of this profile right away; the time of saving is shown next to it. |
| 🐞 Open debug log | button | Opens the log of start, graphics, receiver, speech to text and errors (📁 Folder shows where it is). Please send it to support when something goes wrong. |
| Load aircraft info and photos online | on/off, default on | Type, registration and photo of every received aircraft from hexdb.io and planespotters.net (with the photographer's name, a click opens the photo page). Only the aircraft's ICAO address is sent; results are cached. Off = no lookup. |
| Appearance | Dark / Light | Colour scheme of the interface. Spectrum and waterfall stay dark for better contrast. |
| VFO display | off / on | Audio waterfall on the VFO cards; click it to switch to the audio spectrum. |
| Text size | 70–200 % | Size of the whole interface, also with ⌘/Ctrl + plus, minus, 0. |
| Language | System, Deutsch, English, Français | Language of the interface; System follows your computer's language. |
Own interference scan
Every SDR receiver, its USB connection, the computer and power supplies produce their own spurs – such as harmonics of the receiver's clock. Without a countermeasure they open VFOs full of noise. The own interference scan finds them once and locks them out automatically:
- Stop the scanner.
- Unscrew the antenna from the receiver (fit a 50 Ω terminator if you have one).
- Under Setup click ▶ Start own interference scan. The whole frequency range of the receiver is checked (Airspy about 25–40 s, HackRF up to 6 GHz a few minutes); a bar shows the progress, Cancel stops early.
- Reconnect the antenna and start scanning.
Every frequency is checked from at least two different tuning positions; only interferers that stay in the same place are taken over. The threshold above noise (6–25 dB, default 10) sets how strong an interferer has to be. The list is stored per device type and appears in blue on the Lockout tab.
Files
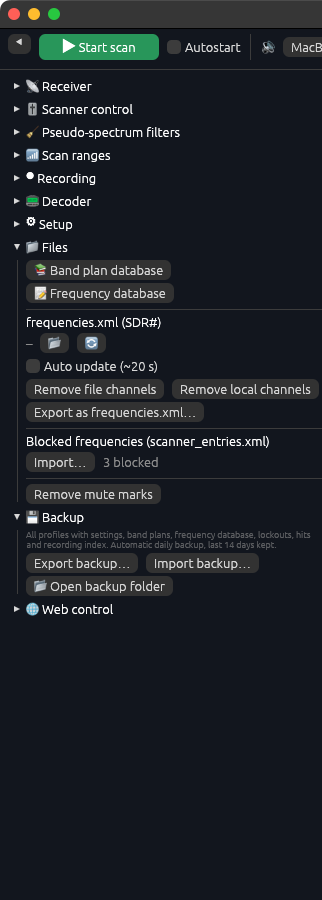
Band plan database and Frequency database open their windows. A frequencies.xml from SDR# can be loaded, reloaded and updated automatically (~20 s); Remove file channels and Remove local channels clear those entries, Export as frequencies.xml… writes the database in SDR# format. Blocked frequencies can be imported from a scanner_entries.xml.
Backup
Export backup… saves all profiles with settings, band plans, frequency database, lockouts, hits and the recording index into one file (.msbackup). Import backup… restores it; profiles with the same name are replaced, the current state is backed up automatically first. In addition the program makes a backup every day and keeps the last 14 days.
7The tabs
VFO – active channels
A card opens for every transmission found. The buttons at the top:
| Setting | Values | Meaning |
|---|---|---|
| ⏸ Pause | The VFO stays open and is not replaced by a new hit; the scanner stays here. | |
| LO | Lockout: ignore this frequency permanently (red). | |
| TMP LO | Temporary lockout until the next program start (orange). | |
| 🔇 | Mute – recording continues. | |
| 🗣 | Speech to text for this channel. The first time, the speech model is downloaded (488 MB). The text appears below the card; the window height is adjustable, 💾 saves, 🗑 clears. The program remembers the frequency: when a VFO opens there again later – even after a restart – speech to text is switched on automatically. With live transcription the text appears while the transmission runs (“● LIVE” line). Full version. | |
| ⏭ | Skip: close the VFO and continue searching. | |
| 💾 | Save as a channel in the frequency database. |
Below: the audio waterfall (click: waterfall ⇄ spectrum), group, signal-to-noise ratio (SNR), duration, frequency with modulation (e.g. “145.5000 MHz NFM”), CTCSS tone, name from the database and a level bar. When the signal is gone, ⏳ counts down the seconds until the VFO closes (see “VFO close after”). Several VFOs are spread across the stereo image by frequency – low frequencies left, high ones right. With decoders switched on, the DCS code and DTMF digits appear on the right of the name line.
Database
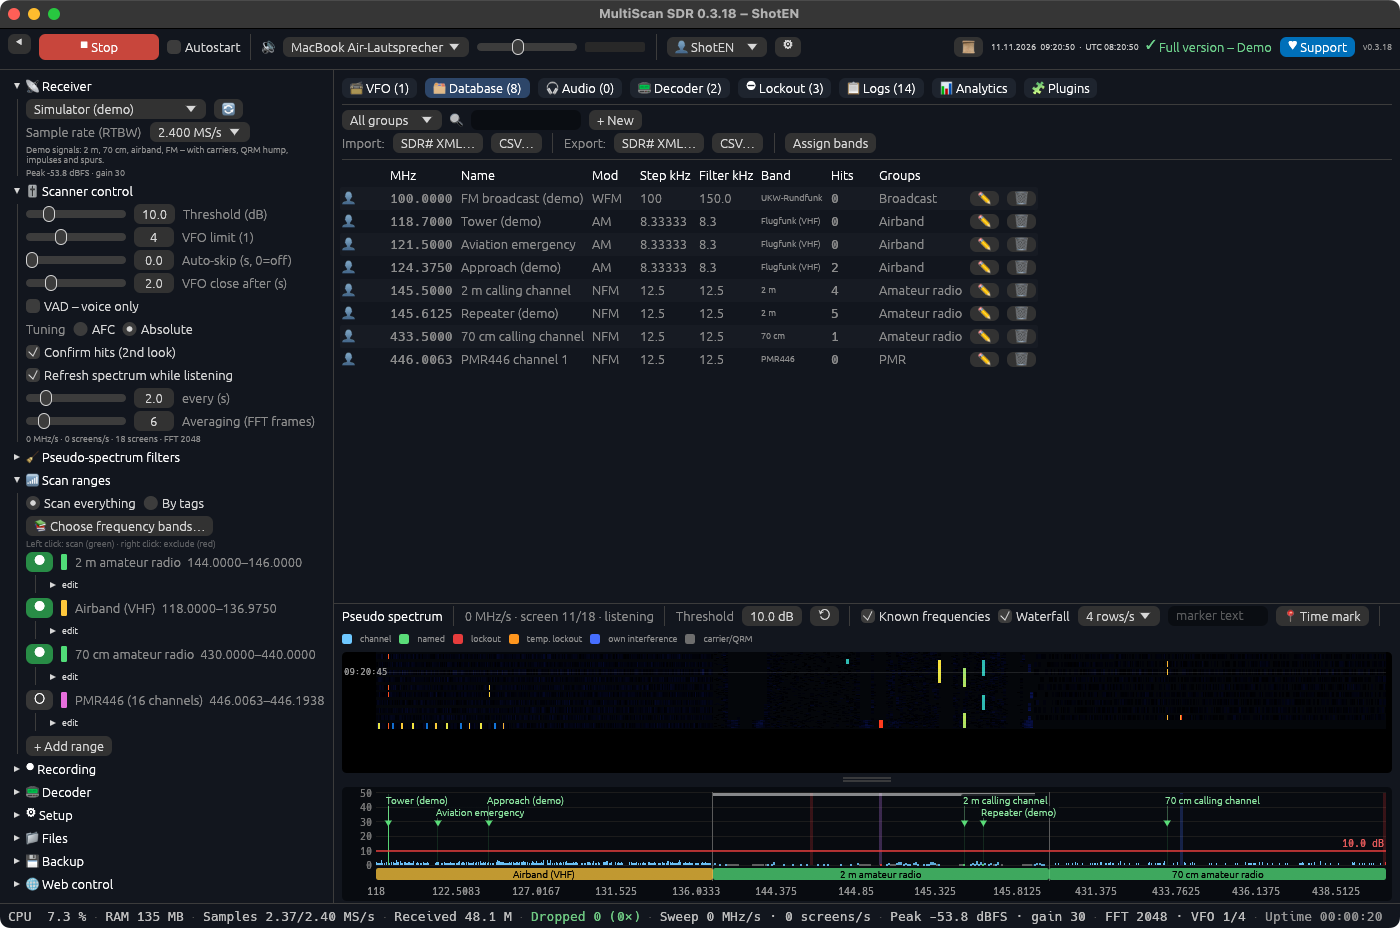
(Full version) All channels of the frequency database with search by name or frequency, groups, hits, mute and lockout state. Editing happens in the Frequency database window:
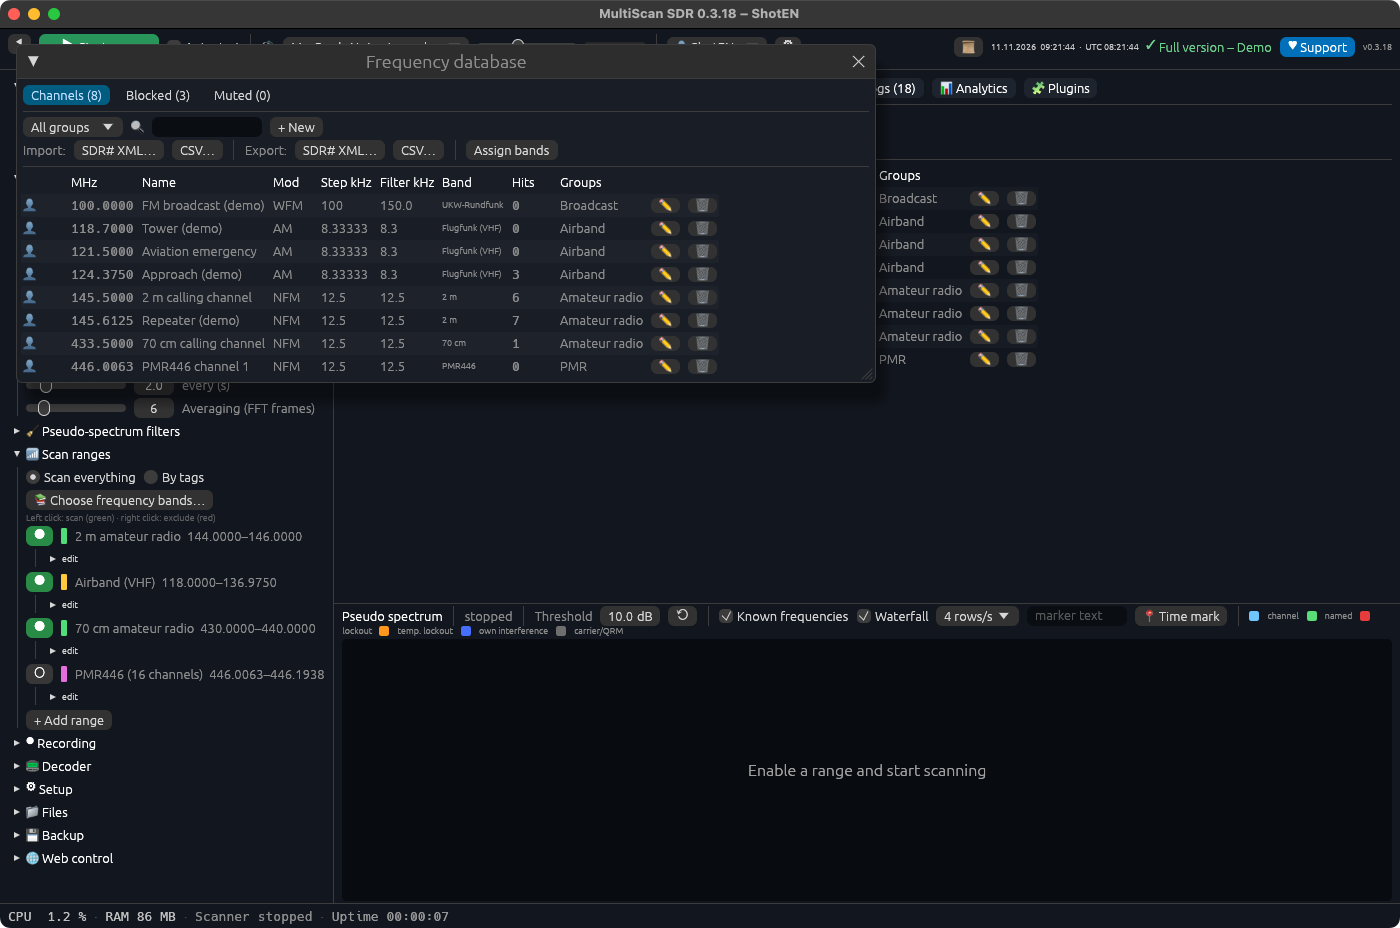
Column widths: drag the line right of a column title, double click restores the default (saved). 📻 ▶ Tune To at the end of the row (or double click a row): the app switches to the VFO tab and receives the frequency with the entry’s modulation and bandwidth – the scanner starts if needed, a decoder mode ends, and if the frequency is in no active scan range it is scanned as a single channel for the time being. The VFO stays paused (⏸ blinks) until you release it. Copy / paste: select rows with click, ⇧-click (range) or ⌘/Ctrl-click (single), ⌘/Ctrl+C copies them as a table (MHz, name, mod, filter kHz, step kHz, groups, band), ⌘/Ctrl+V pastes such rows – also from Excel, Numbers or a text file, separated by tab, semicolon or comma; a column of frequencies is enough. Frequencies already in the list are skipped. Both also in the context menu (right click).
Columns: frequency, name, modulation, bandwidth, step, groups/tags (separated by ;), band, mute, locked. Assign bands fills empty band fields from the active band plan. Import and export as SDR# XML and CSV.
Audio
List of recordings with play, stop, delete and open folder. If recording is off, a note says so.
Lockout
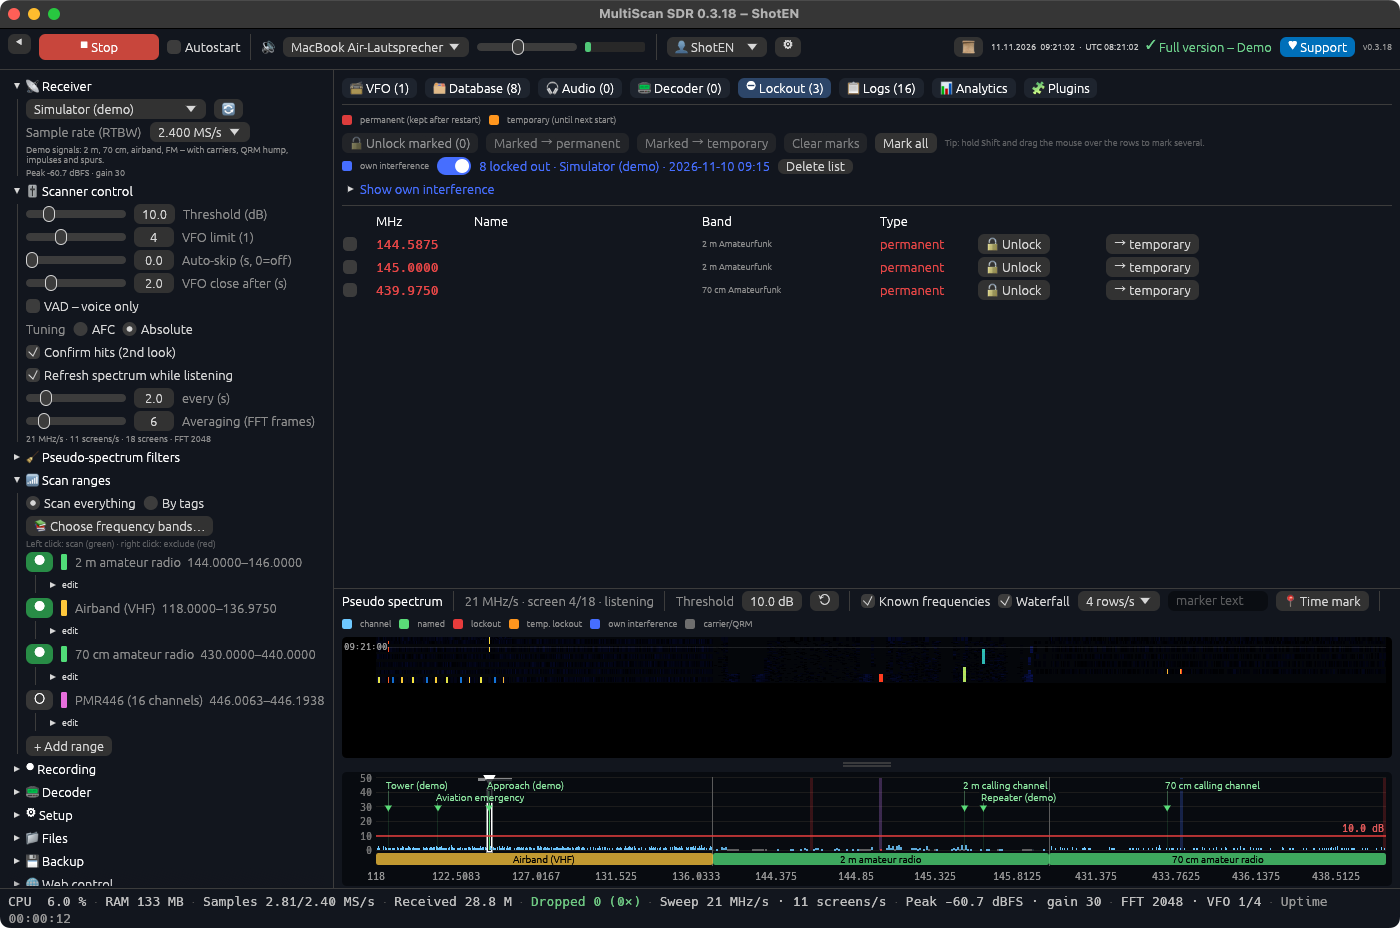
| Setting | Values | Meaning |
|---|---|---|
| Red – permanent | Stays locked after a restart. | |
| Orange – temporary | Until the next program start; “Unlock all temporary” clears them all. | |
| Blue – own interference | switch on/off | Result of the own interference scan. The switch locks all or none; “Show own interference” lists them with level, ✖ removes single entries, “Delete list” all. |
| Multi-select | Tick the boxes or hold Shift and drag the mouse over the rows. Then: unlock marked, → permanent, → temporary, clear marks, mark all. |
Logs
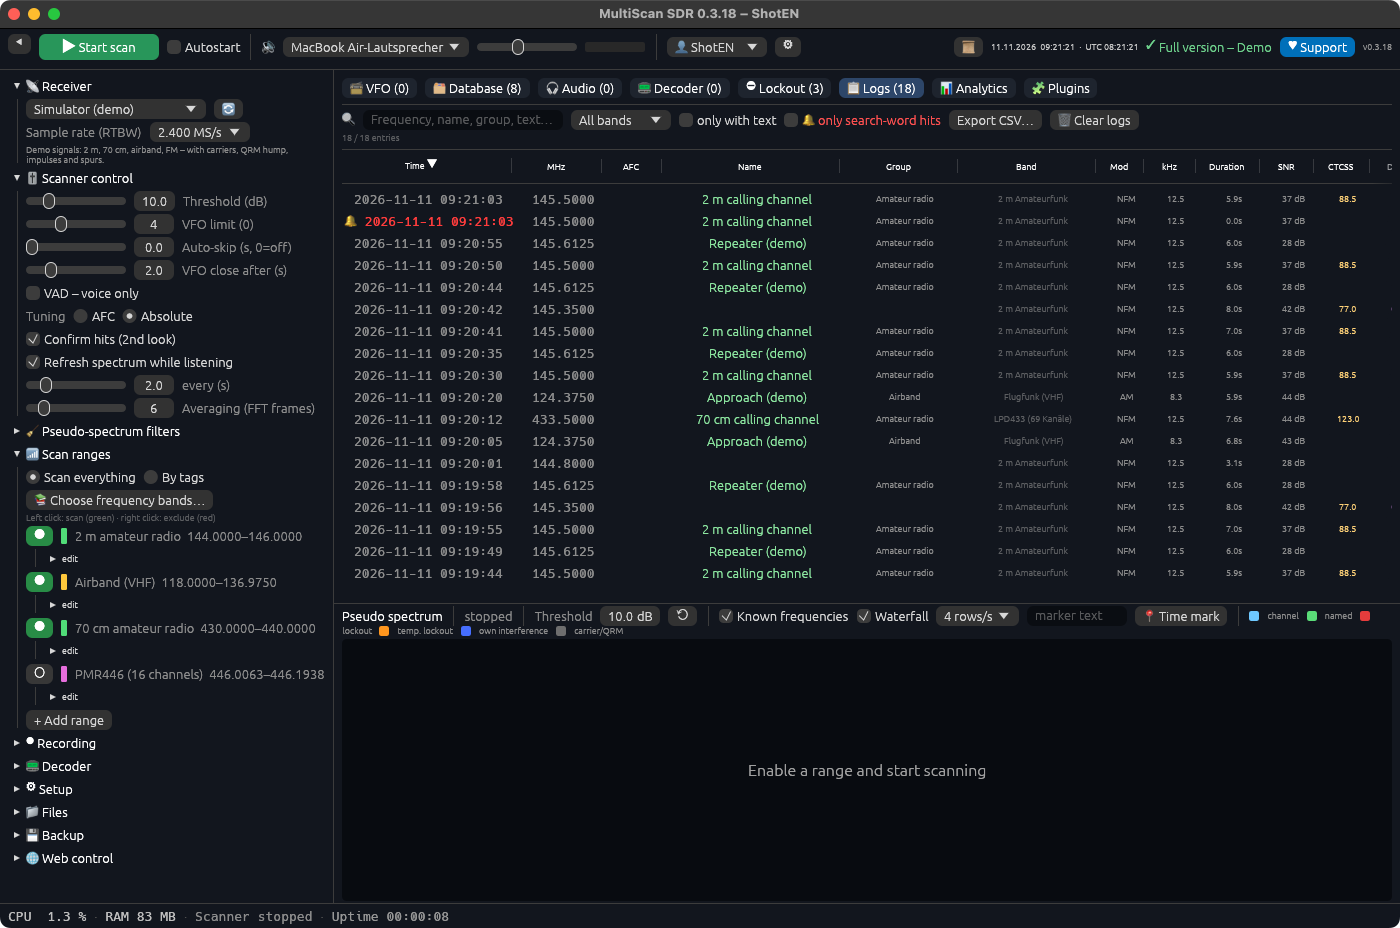
Every activation with time, duration, frequency, name, group, band, modulation, SNR and – if available – the speech-to-text transcript. Search-word hits are separate rows in red with 🔔, the words highlighted in red in the text; “🔔 only search-word hits” shows just these. Search, band filter, “only with text”, sort by clicking the column headers, column width by dragging the line right of the header (double click = default, saved), play the recording, CSV export and clear. The columns DCS and DTMF show what was decoded during the transmission.
Analytics and Plugins
Prepared for evaluations (busy frequencies, times of day, statistics per band) and extensions (e.g. digital modes, network audio) – coming soon.
8Pseudo-spectrum and waterfall
Every bar is a channel; its height is the distance to the noise in dB. Several bands stand side by side; the coloured strip at the bottom shows the band.
| Setting | Values | Meaning |
|---|---|---|
| Colours | Light blue = channel, green = known frequency, red = lockout, orange = temporary lockout, blue = own interference, grey = filtered carrier/QRM. | |
| Click | Puts a VFO on the frequency (in the spectrum or the waterfall). The VFO is held (⏸) until you release it; when all VFOs are in use, the one quiet the longest makes room. | |
| Double click | Brings the frequency to the centre of the view (zooms in when the whole range is shown). | |
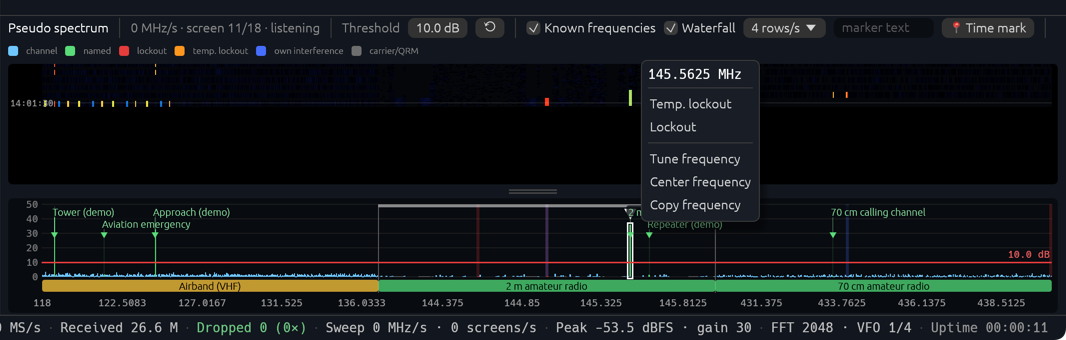
| Right click | Menu with the frequency: Temp. lockout, Lockout (each can also be removed), Tune frequency, Center frequency, Copy frequency (in MHz to the clipboard). | |
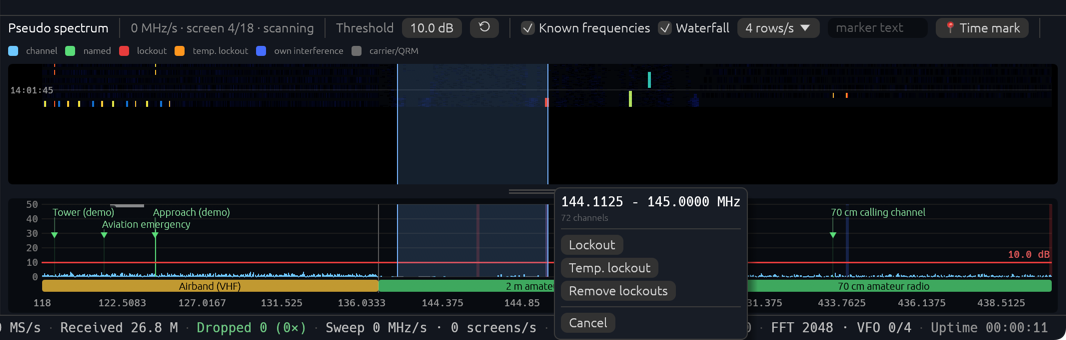
| Click and drag | Marks a frequency range (blue). Then: Lockout, Temp. lockout, Remove lockouts or Cancel (also Esc). | |
| Scroll wheel / pinch | Zoom in and out; Shift + drag (or the middle button, sideways trackpad scrolling) moves the view; ⟲ resets the zoom. | |
| Red line | The threshold – drag it up or down with the mouse. | |
| Known frequencies | on/off | Names from the frequency database, staggered over several rows so they don't overlap. |
| Waterfall | on/off, rows/s | History of the last minutes with clock time; the divider between waterfall and bars can be dragged (double click = default). |
| Time mark (key M) | Puts a marker with optional text into the waterfall. |
9Decoders (full version)
MultiScan SDR has two kinds of decoders. Inside the VFOs CTCSS, DCS, DTMF, ACARS and packet radio run while scanning – switch them on in the left menu under 📟 Decoder. Wideband decoders for ADS-B, AIS and 433 MHz need the receiver for themselves: choose them under Mode, then ▶ Start decoder. All results are in the 📟 Decoder tab (between Audio and Lockout), one row per aircraft, ship or sensor, the latest reception always on top. Tables and temperature curves survive a restart (14 days). In addition every reception goes into the Logs tab (group “Decoder”): one entry per aircraft, ship or sensor and contact – a new one after a 10-minute pause – plus every ACARS and packet message. Can be switched off in the left menu under 📟 Decoder.
✈ Aircraft (ADS-B, 1090 MHz)
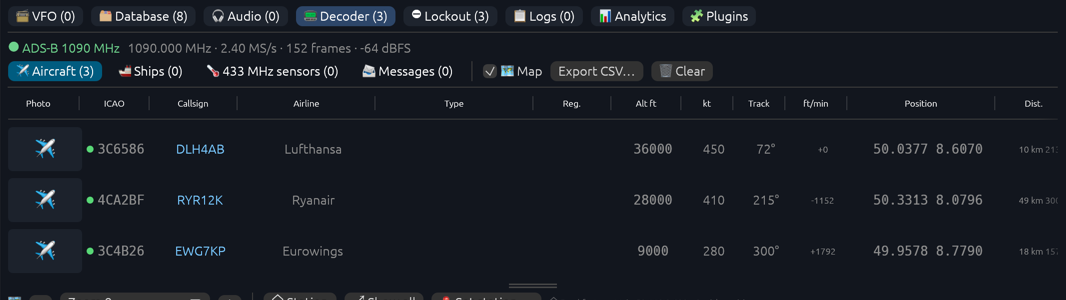
The receiver sits on 1090 MHz (at least 2 MS/s – RTL-SDR, HackRF and Airspy can do this). Callsign, altitude, speed, track, climb/descent rate, position and squawk (7500/7600/7700 in red) are decoded. The airline follows from the callsign. Type, registration and a small photo are added online when this is switched on in Setup – hover over the photo to enlarge it, a click opens the photographer's page. A click on the position shows it on OpenStreetMap. An antenna for 1090 MHz works best (the whip from the RTL-SDR kit is enough for aircraft a few dozen kilometres away). 1030 MHz carries the interrogations of the ground stations; 978 MHz (UAT) is used in the USA only.
The list stays calm: new aircraft are added on top, the order does not jump with every frame. A green dot behind the ICAO address lights up briefly when the aircraft has just sent. With your own station, the column Dist. shows distance and bearing.
🗺 Map
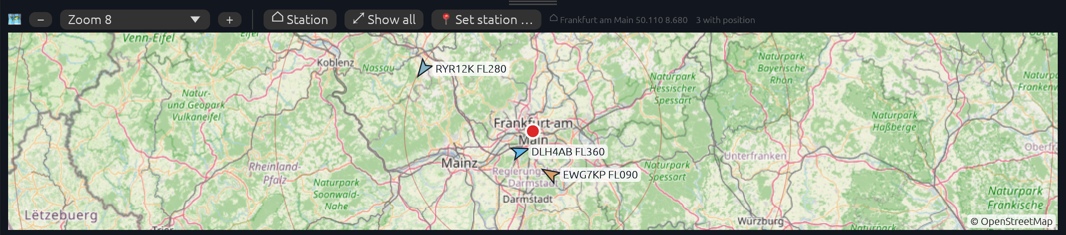
Below the aircraft and ship tables a map (OpenStreetMap) shows every position: aircraft as an arrow along their track with a trail, coloured by altitude (orange low, blue high), ships as a dot with a course line. The divider between table and map can be dragged, “🗺 Map” hides it. Zoom with the wheel, “−”/“+” or the list of zoom levels (continent to buildings), drag to move, double click to zoom in. “⌂ Station” centres on your station, “⤢ Show all” fits the view. Map tiles are cached.
📍 Own station
“📍 Set station …” opens a window: 🌐 Find automatically gets the approximate position from the internet connection (about city level); or enter city and country and press 🔎 Search, or type latitude/longitude. The station is saved in the profile and therefore in every backup.
🚢 Ships (AIS, 161.975 / 162.025 MHz)
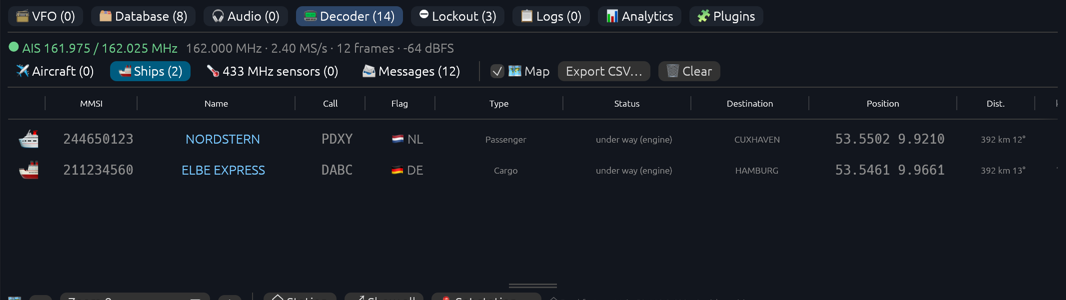
Both AIS channels are received at the same time. Shown are MMSI, name, callsign, flag (from the MMSI), ship type, navigation status, destination, position, speed over ground, course, length, class A/B and the channel. Instead of a photo, an icon shows the ship type.
🌡 433 MHz sensors
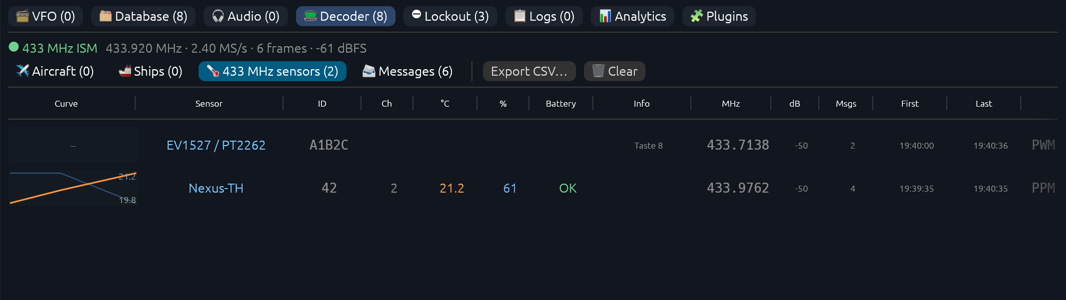
The whole 433 MHz band (433.05–434.79 MHz) is watched. Thermometers and weather stations using the Nexus and Prologue schemes (many low-cost wireless thermometers, e.g. Nexus, Rubicson, Sencor, Digoo) show temperature, humidity, channel and battery; the small curve shows the temperature (orange) and humidity (blue). Wireless remotes, door bells and motion sensors (EV1527/PT2262) appear with their ID and key. Other devices are listed with their bit pattern as “?”. The CSV export contains every reading with its time – ready for a spreadsheet.
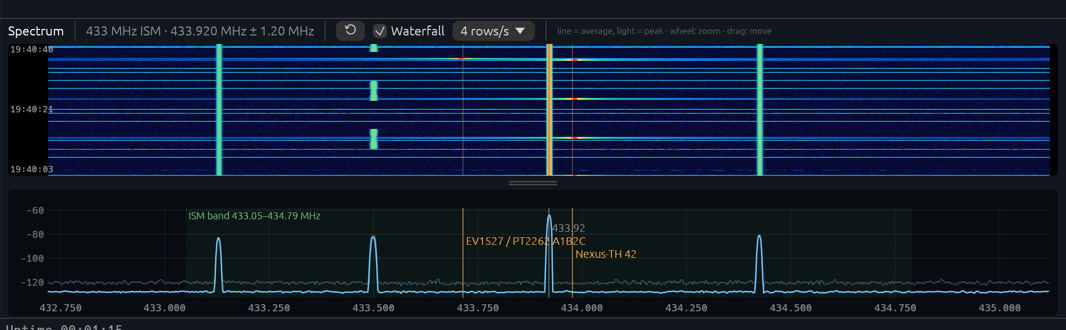
Below, spectrum and waterfall show the real spectrum around the decoder frequency in decoder mode (instead of the pseudo-spectrum): the line is the average, the light curve the peak, and the waterfall shows short transmissions too. ADS-B 1090 MHz, the AIS channels A and B, or the 433 MHz band with the sensors found at their frequency are marked. The wheel zooms, dragging moves, double click or ⟲ shows everything again.
📨 Messages
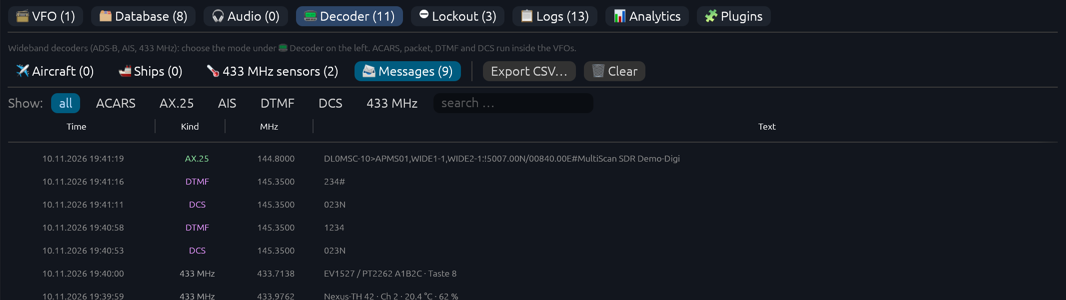
ACARS messages, packet radio frames, AIS messages, DTMF sequences, DCS codes and 433 MHz receptions with time and frequency, newest on top. Filter by kind and search help with many entries. Note: while the scanner listens on other frequencies, a short ACARS or APRS transmission can be missed – for reliable reception scan a range of its own (e.g. 131.7–131.9 MHz) or use a profile of its own.
| Setting | Values | Meaning |
|---|---|---|
| Export CSV… | button | Saves the table shown (for 433 MHz every reading) as a CSV file. |
| 🗑 Clear | button, asks first | Deletes all tables and messages. |
| Column width | Drag the line right of the column header, double click = default. |
10Web control – operate and listen in a browser (full version)
MultiScan SDR can be remote-controlled from any browser in the same network – a phone, tablet or another computer. Nothing needs to be installed: the page comes straight from the program.
| Setting | Values | Meaning |
|---|---|---|
| Enable remote control | on/off | Starts the small web server inside the program. The first time, the firewall (macOS/Windows) asks whether incoming connections are allowed – please allow them. |
| Web port | 1024–65535 (default 8090) | Port of the web page. If it is in use a message appears – choose another one and press Apply. |
| Enable audio stream | on/off | Lets the browser listen: all audible VFOs as a stereo mix (24 kHz, about 100 kB/s, roughly 0.3–0.5 s delay). Muted VFOs stay muted. The computer needs an audio output device. |
| Open in a browser | address / QR code | The address contains an access key (…?k=…). Scan the QR code with the phone or copy the address (📋). The second address ending in .local also works when the IP address changes. |
| 🔑 New access key | Creates a new key – all links handed out before stop working. |
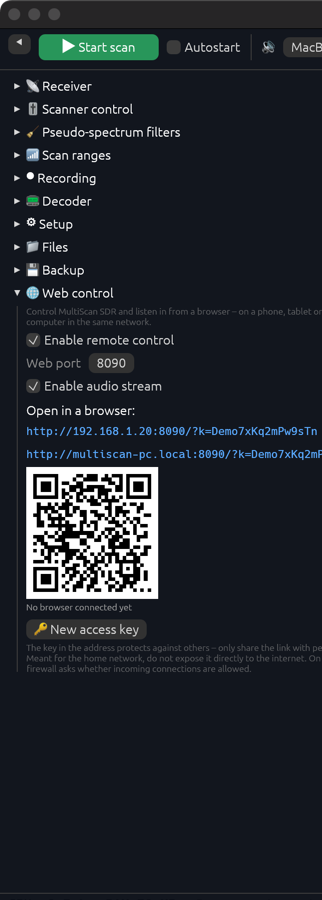
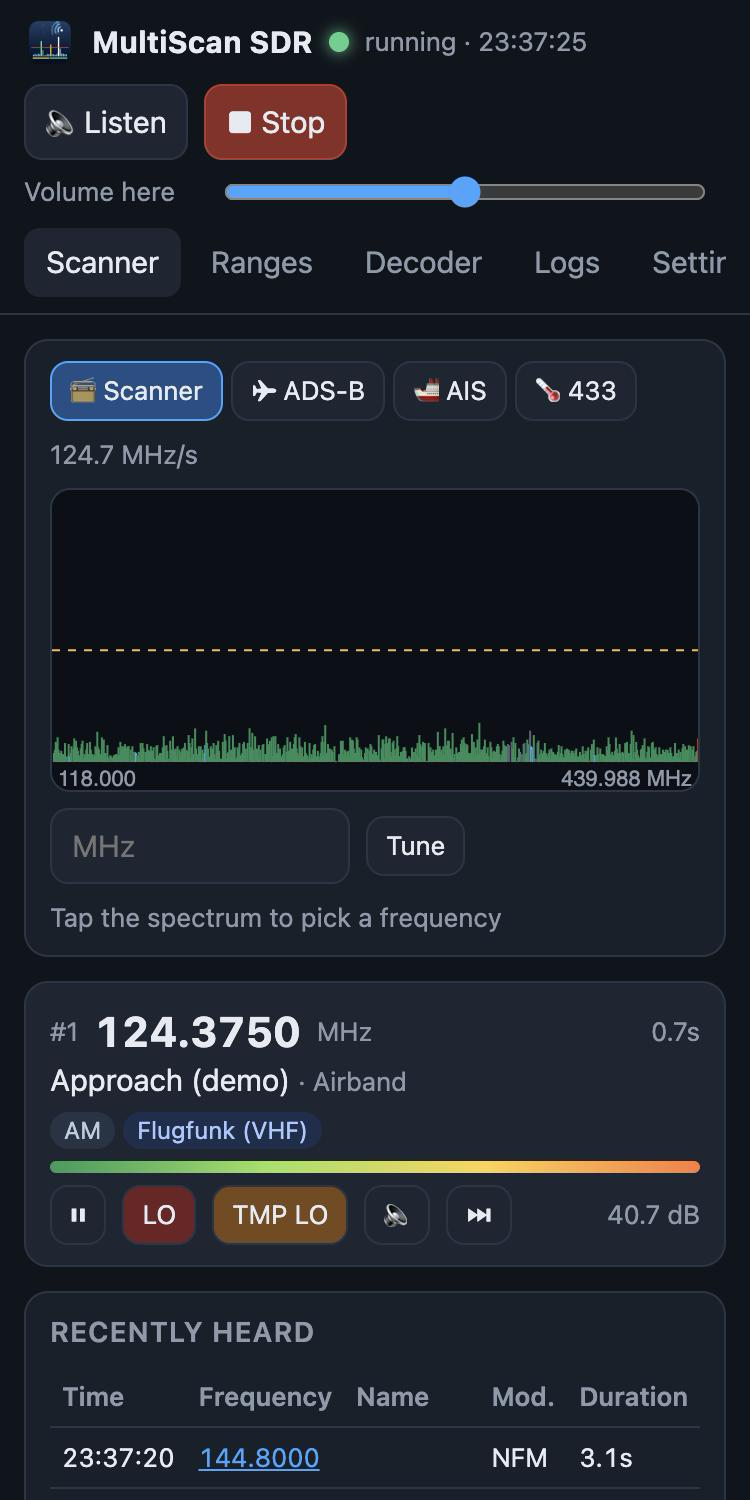
Using the page: at the top are the status, 🔈 Listen (with its own volume in the browser) and ▶ Start / ■ Stop. The Scanner tab shows the mode (scanner, ADS-B, AIS, 433 MHz), the pseudo-spectrum – tap it to pick a frequency to tune or lock out (LO / TMP LO) –, a field for a frequency in MHz and the active VFOs with pause, lockout, mute and skip. Ranges switches the scan ranges on, off or to exclude. Decoder shows aircraft, ships, sensors (with temperature curve) and messages, Logs the latest entries. Settings changes the threshold and the volume on the computer.
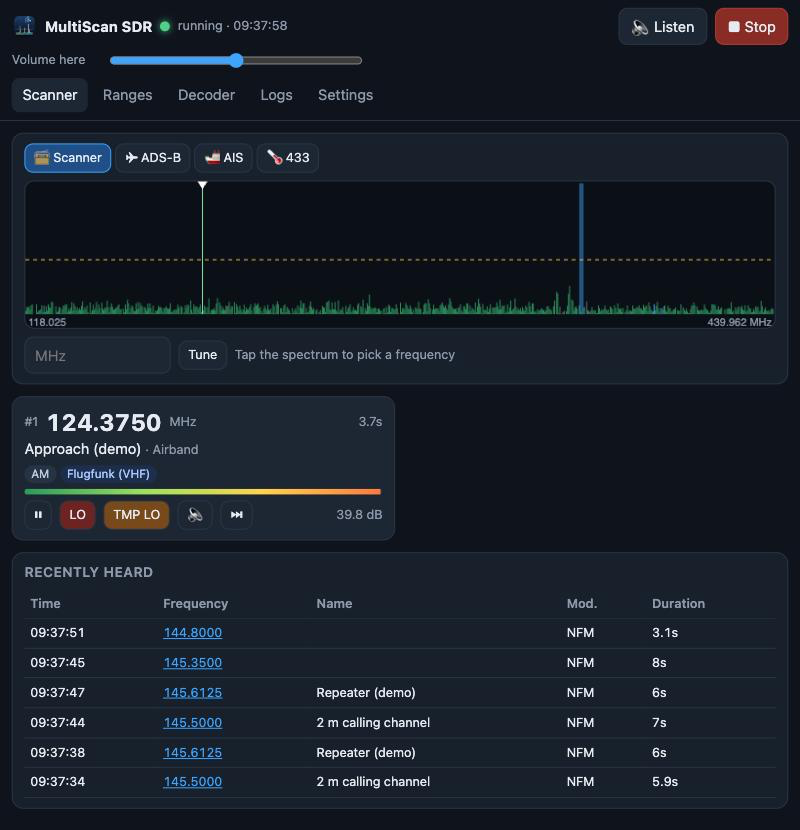
When a decoder is chosen – in the browser or on the computer – the page switches to the Decoder tab with the matching table by itself (ADS-B → aircraft, AIS → ships, 433 MHz → sensors); back in scanner mode the Scanner tab returns. If you hear nothing when listening, reload the page once completely; next to the volume slider a status line shows whether audio arrives (e.g. ▶ 400 ms · 1.2 MB).
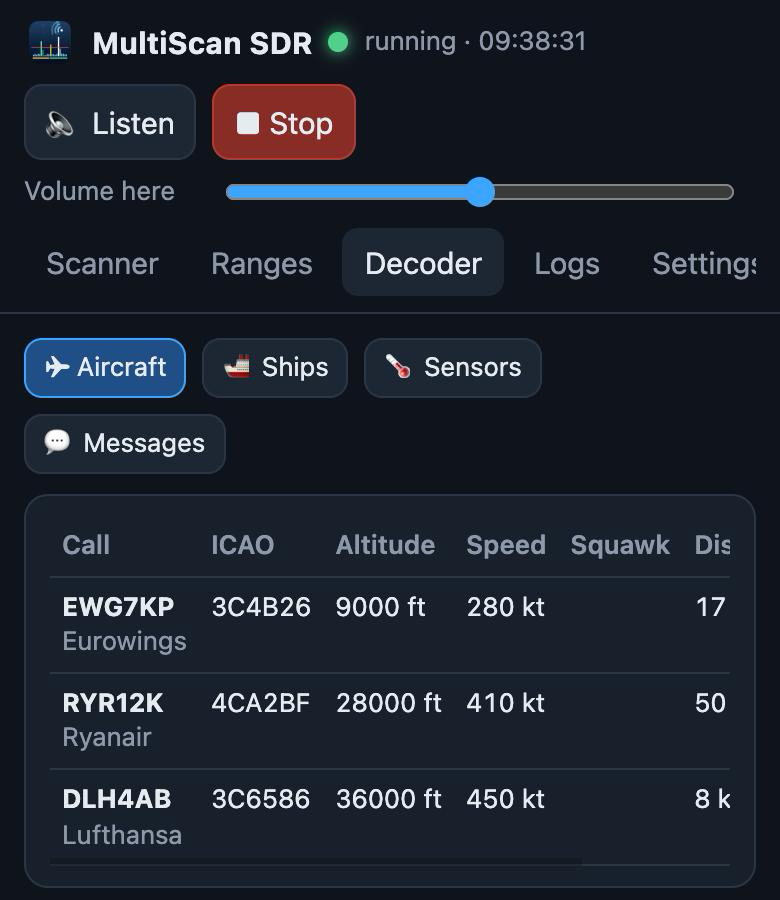
Tip: choose “Add to Home Screen” in the browser menu – the page then starts like an app. Security: web control is meant for the home network. Do not forward the port to the internet in your router; for access on the road use a VPN into your home network.
11Band plan database
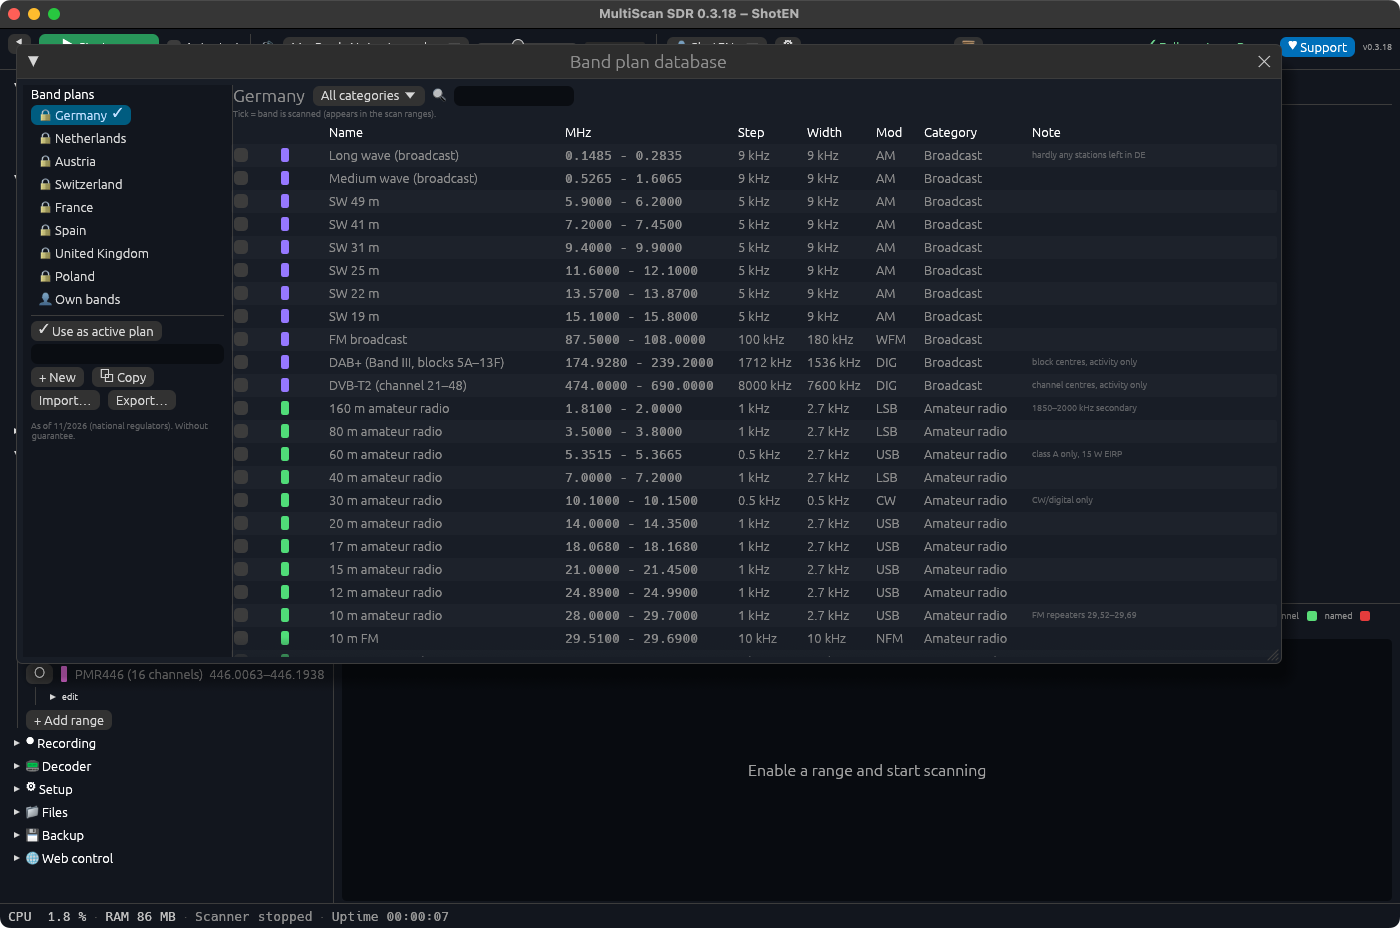
Band plans for Germany (up to 5 GHz, as of 11/2026), the Netherlands, Austria, Switzerland, France, Spain, the United Kingdom and Poland with category, range, step and modulation. A tick adds the band to the scan ranges. Under Own bands you can create your own bands; ⧉ Copy makes an editable copy of a plan, ✓ Use as active plan sets which plan is used to assign bands in the database. Import and export as a file. No guarantee for the data.
12Status line
CPU load and memory, measured and set sample rate, received samples, Dropped (samples that could not be processed in time – should stay 0), sweep speed in MHz/s and screens/s, peak level, gain, FFT size, open VFOs and uptime.
13Tips and troubleshooting
| Setting | Values | Meaning |
|---|---|---|
| Features greyed out (🔒) | They belong to the full version – see “Free version and full version”. | |
| VFO closes too early | Raise “VFO close after” in Scanner control, e.g. to 10–30 s for airband, so the reply also lands on the same VFO. | |
| VFOs open on noise | Usually the receiver's own interference: run the own interference scan or lock the frequency with LO. For data bursts (e.g. DMR on 70 cm) “VAD – voice only” helps. | |
| “Dropped” increases | Lower the sample rate, reduce averaging or run fewer VFOs with speech to text. | |
| Device not found | Press 🔄, try another USB cable/port; on Windows switch the driver to WinUSB with Zadig. A device can only be used by one program at a time. | |
| Program hangs at start / does not start | The log debug.log records every start step, even when no window appears – Mac: ~/Library/Application Support/MultiScan, Windows: %APPDATA%\MultiScan. If the start hangs, close the program and start it again: it then tries another graphics output by itself (on Windows Direct3D 12 → OpenGL → automatic). By hand: MultiScan.exe --renderer glow. | |
| Decoder shows nothing | ADS-B: antenna for 1090 MHz, a clear view of the sky helps. AIS: near the coast or rivers with ship traffic. 433 MHz: sensors often send only every 30–60 s. The status line in the Decoder tab shows frequency, sample rate, number of frames and level. | |
| Web page not reachable | Is the phone in the same Wi-Fi as the computer? Firewall question allowed (macOS: System Settings ▸ Network ▸ Firewall; Windows: Windows Security ▸ Firewall ▸ Allow an app)? Guest Wi-Fi networks often keep devices apart. Try the IP address instead of the .local name. | |
| Overload | Level meter red or many ghost lines: lower the gain or keep overload protection on. |
Keyboard shortcuts
| Setting | Values | Meaning |
|---|---|---|
| ⌘/Ctrl + plus / minus / 0 | Interface larger, smaller, 100 % | |
| M | Time mark in the waterfall |
14Note on radio reception
Laws on radio reception differ from country to country. In Germany, for example, § 5 TDDDG only allows listening to transmissions intended for the operator of the receiver, for radio amateurs, for the general public or an unspecified group of people; the content of other transmissions and the fact that they were received must not be passed on – not even after accidental reception, and this includes recordings and transcripts. Please observe the rules of your country.